
20-level order book
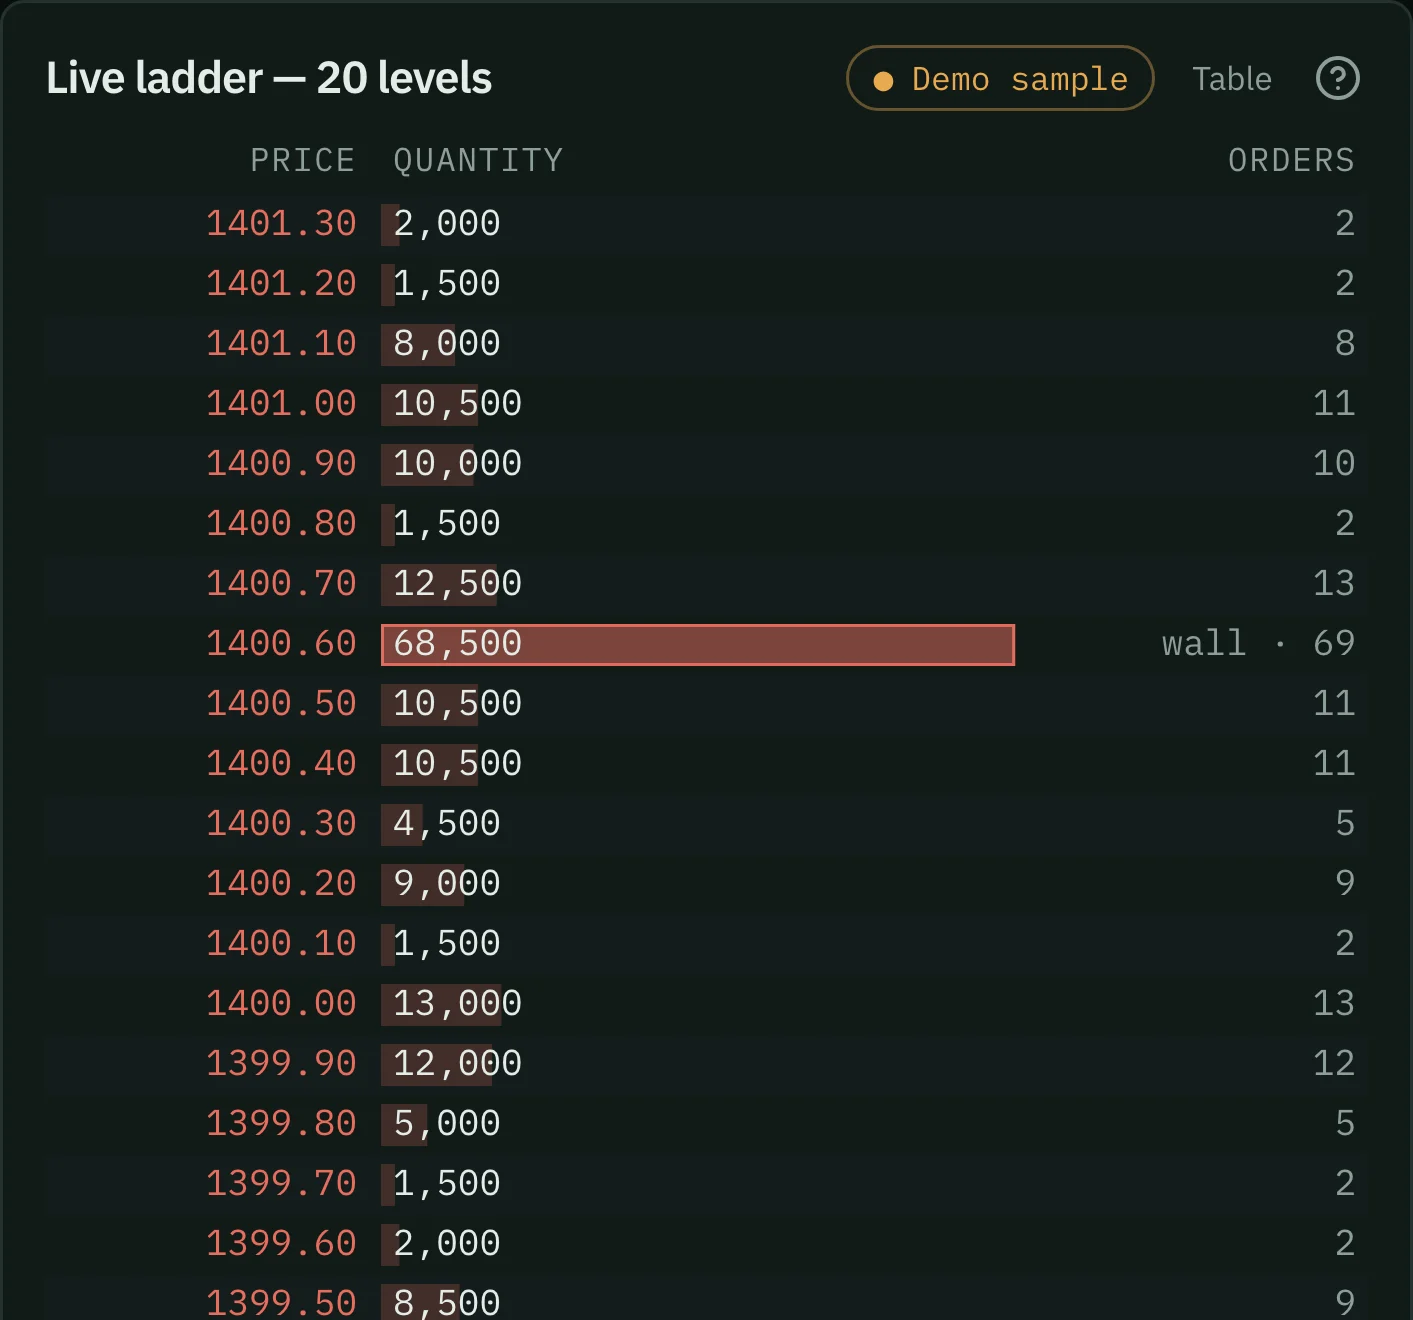
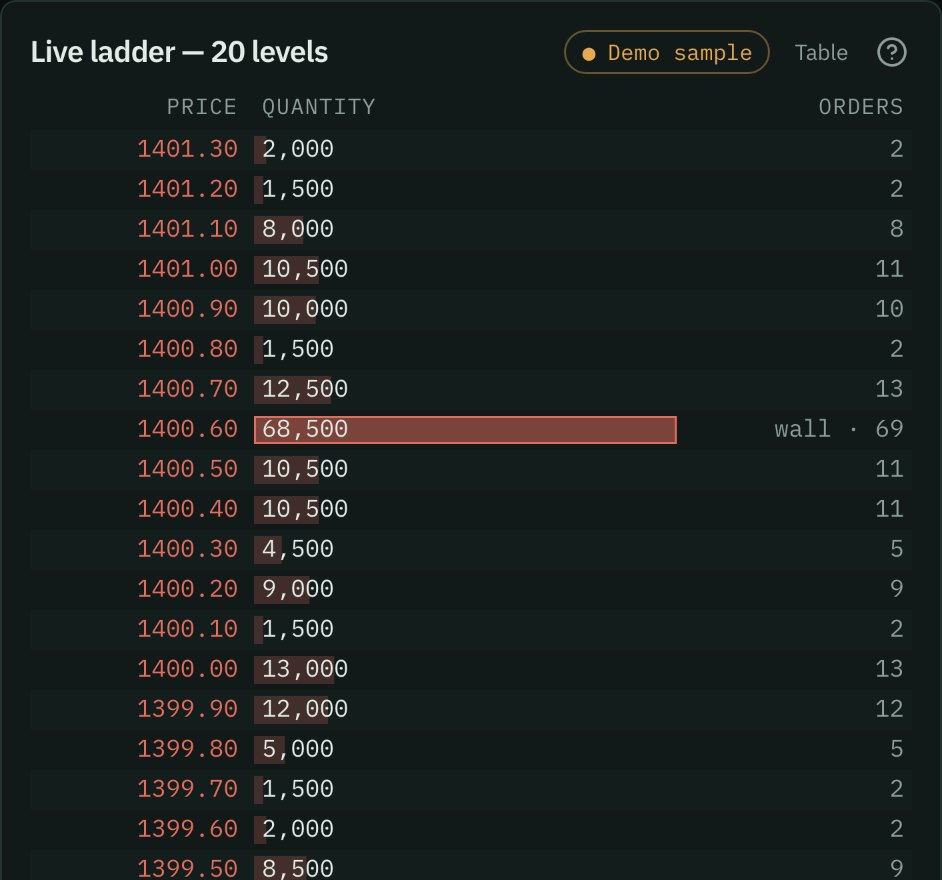
Dhan streams 20 price levels on each side of the book over its API. That is what our Depth agent reads: imbalance against the session, the top 5 levels against all 20, and unusually large resting orders.
Crewdesk · eight agents in your browser
Eight specialists watch the indices and F&O stocks for you — breadth, order flow, the order book, option chains, open interest and volatility — and show you exactly what they measure. You make the call.
Measurements only — not investment advice. No order placement. Nothing to install: it runs in your browser.
A pixel-art office where the eight agents sit at their desks, type, walk to a whiteboard and speak sample measurements, each led by the instrument it is about. It is a scripted illustration, not market data. Use the name tags to see what each agent measures.
8
specialised agents
One per page, each watching one part of the market.
227
F&O stocks tracked
Every NSE F&O stock, plus the 5 indices and India VIX.
16
NSE sector indices
Each compared with its previous close.
20
order-book levels
The full depth for NSE instruments.
Meet the team
Each agent watches one thing and measures it. Every observation leads with the instrument it is about and links back to the data behind it, so you can check it yourself.
 Free
On the Dashboard page
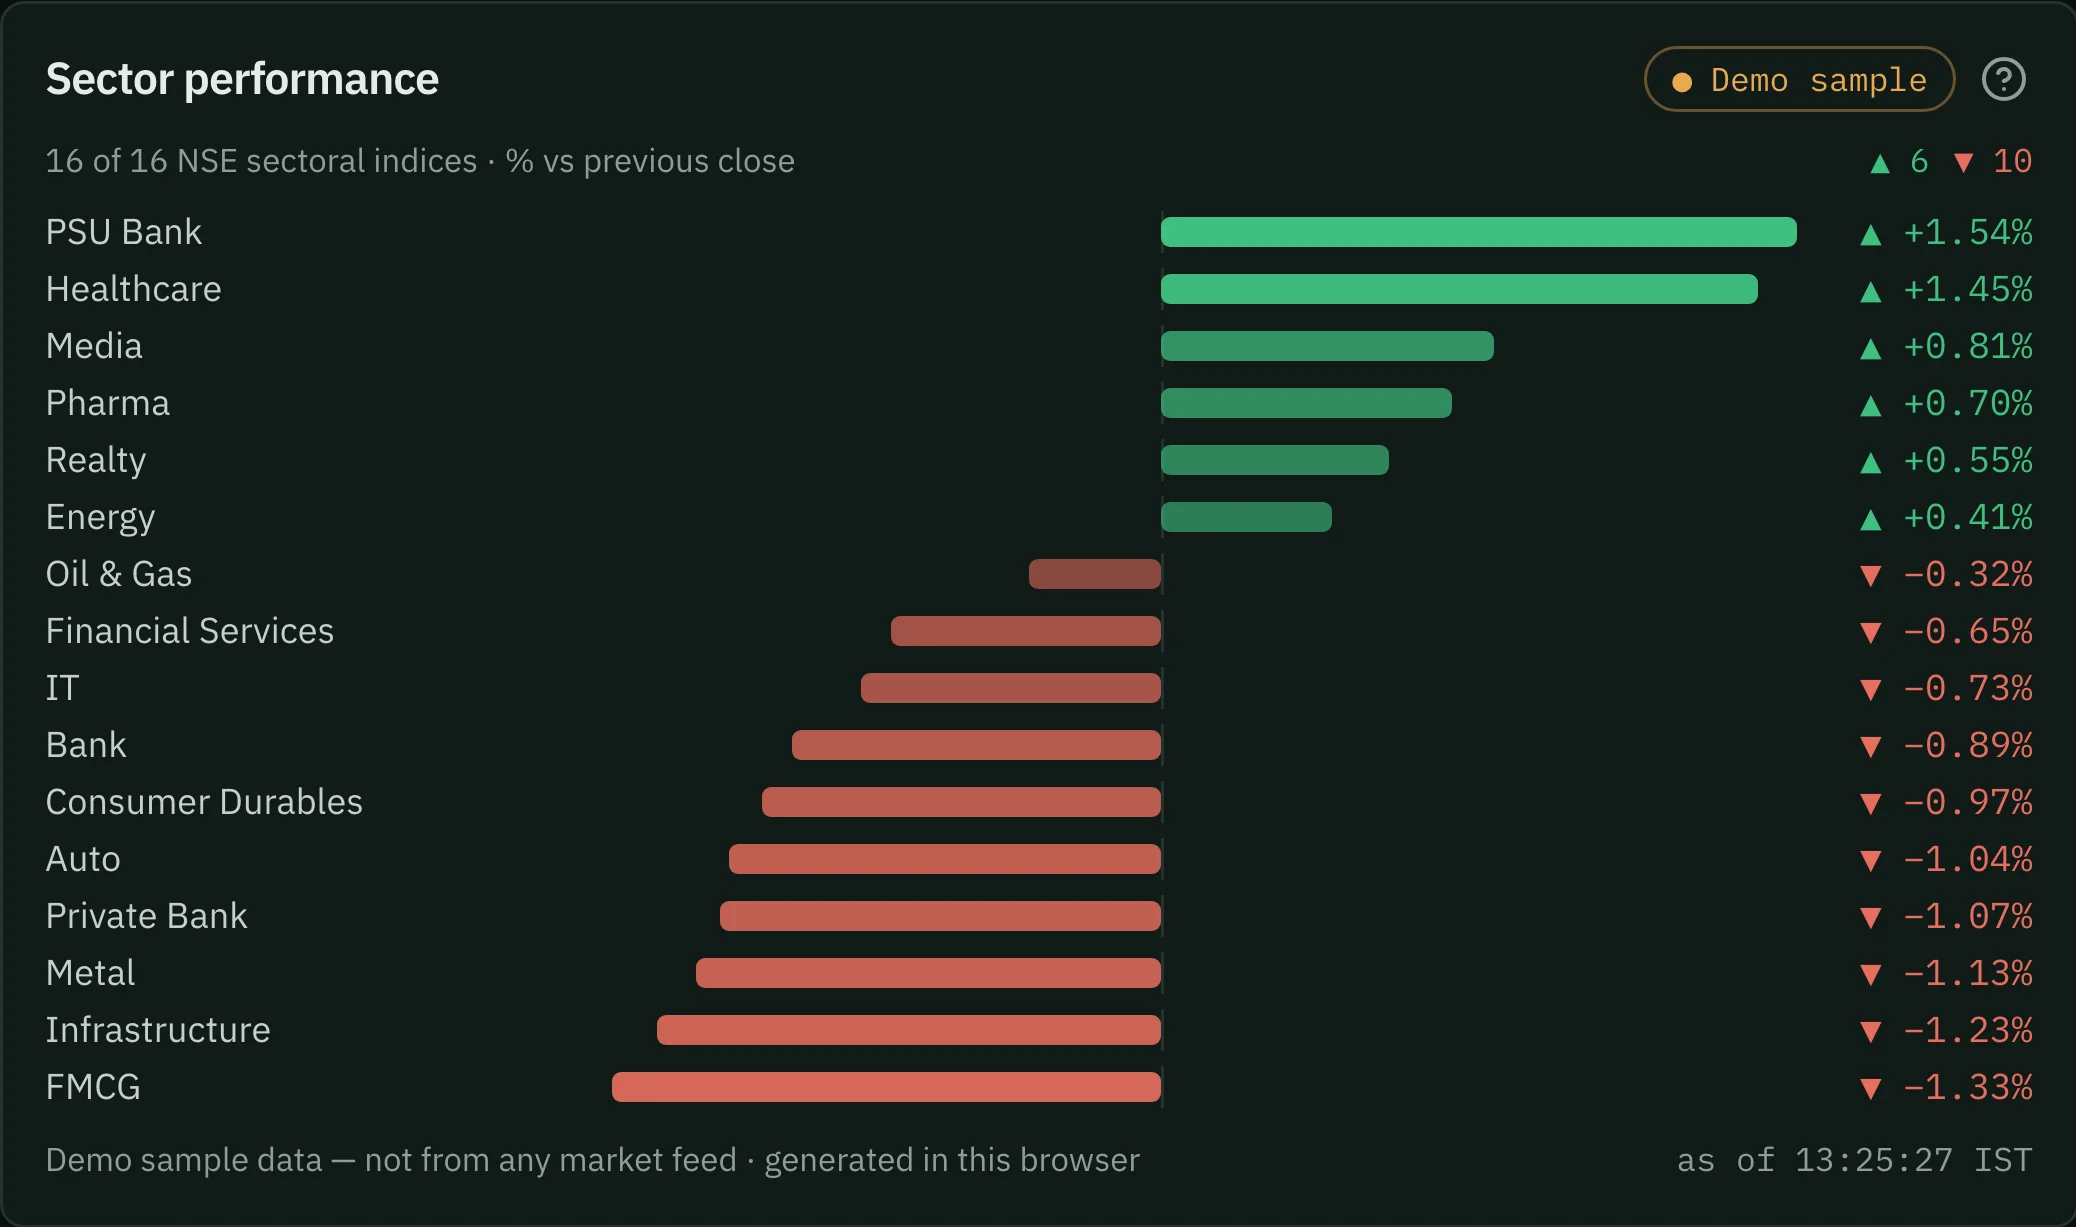
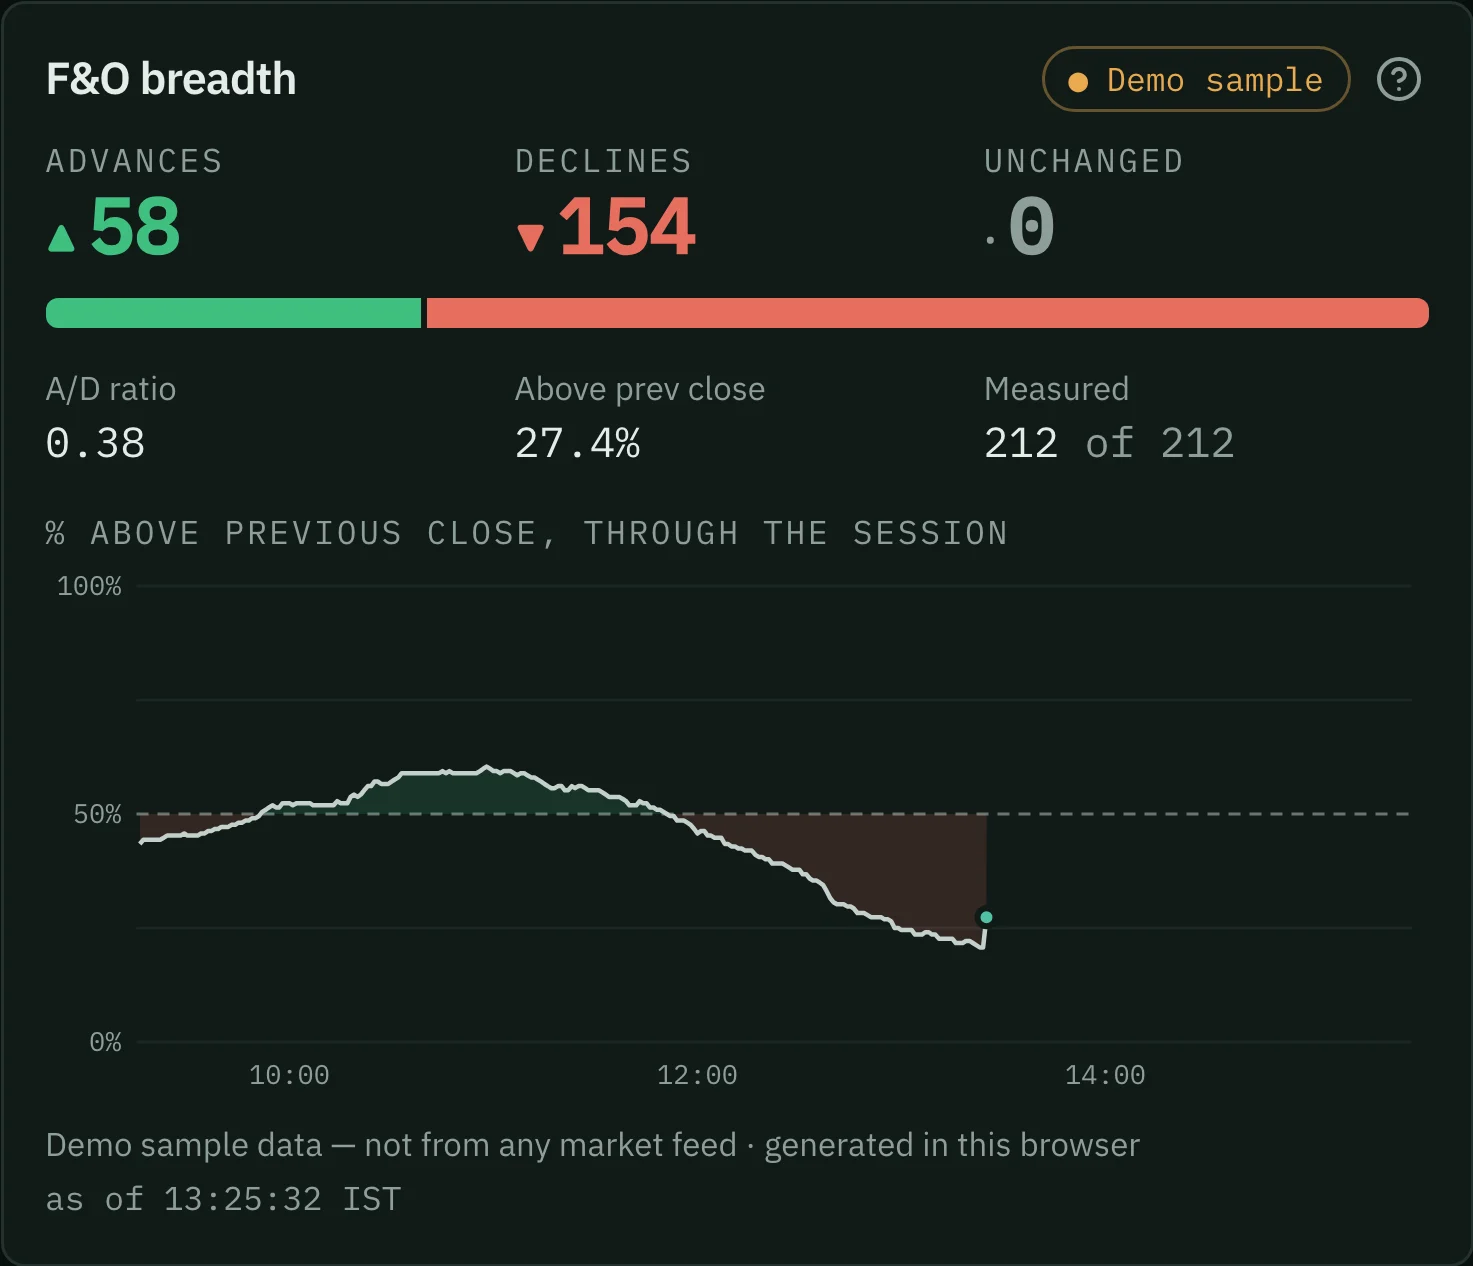
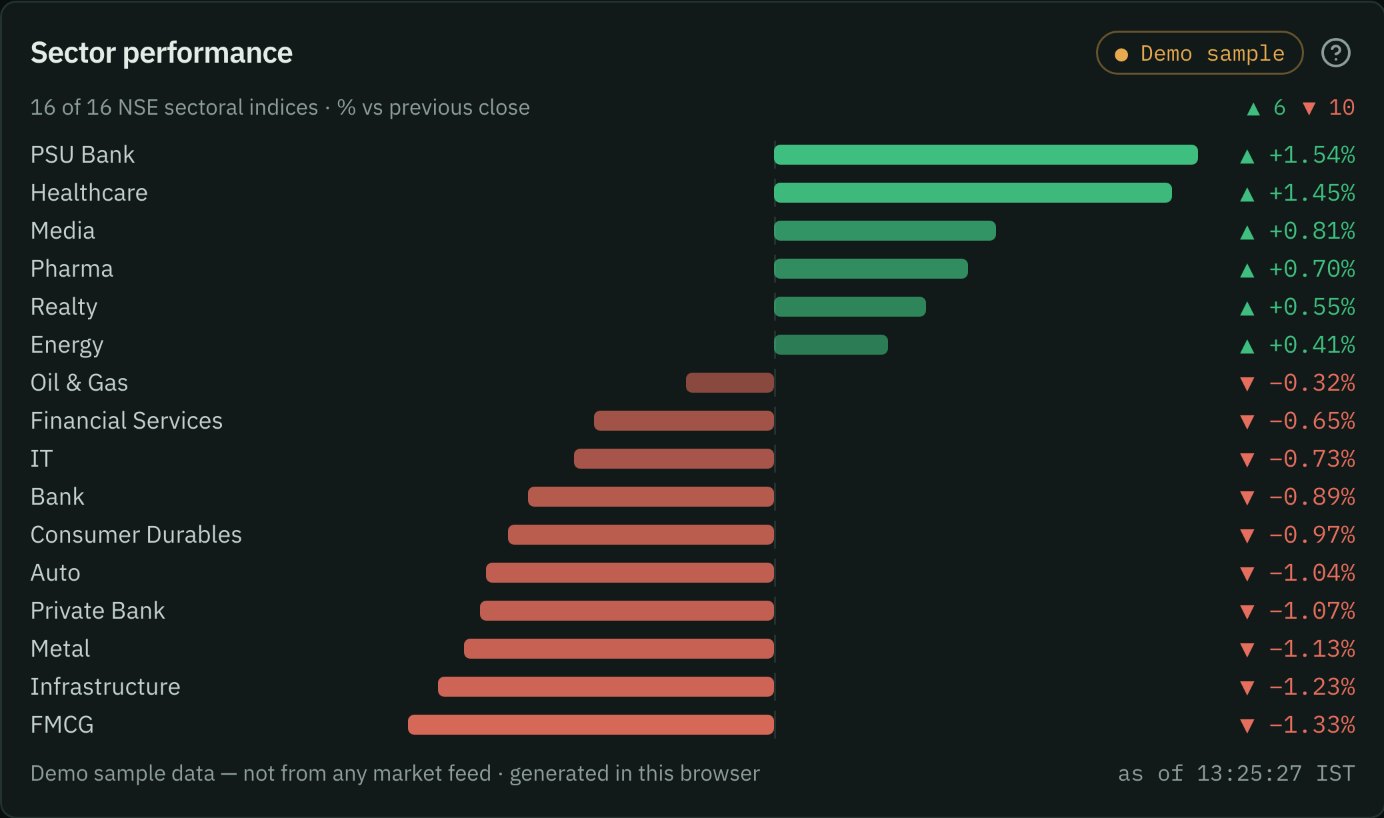
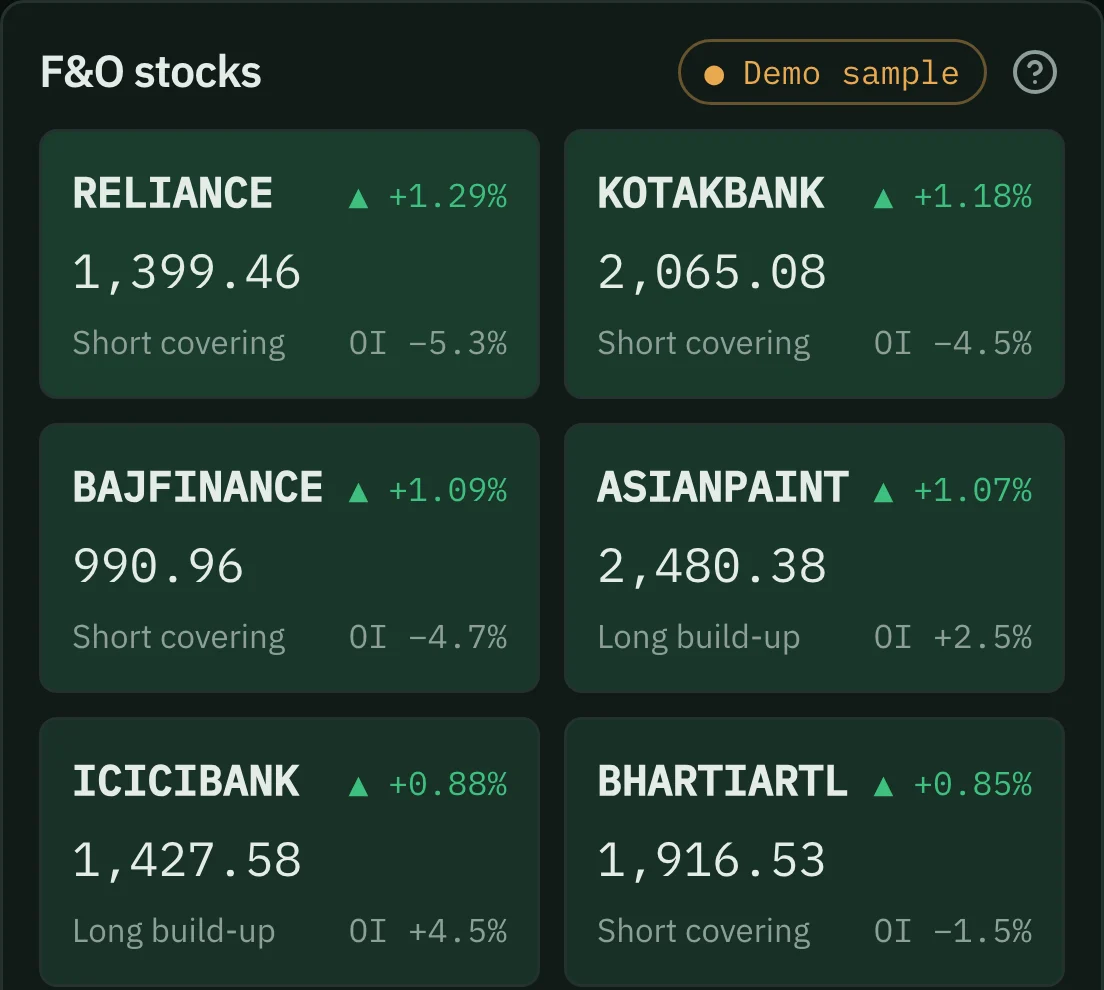
The market board: the five indices and India VIX, 16 NSE sectoral indices, breadth across every F&O stock, futures OI build-up and the day's biggest movers.
Sample observationNSE F&O · Sectors above previous close: 6 of 16
See it live in the demo Free
On the Order flow page
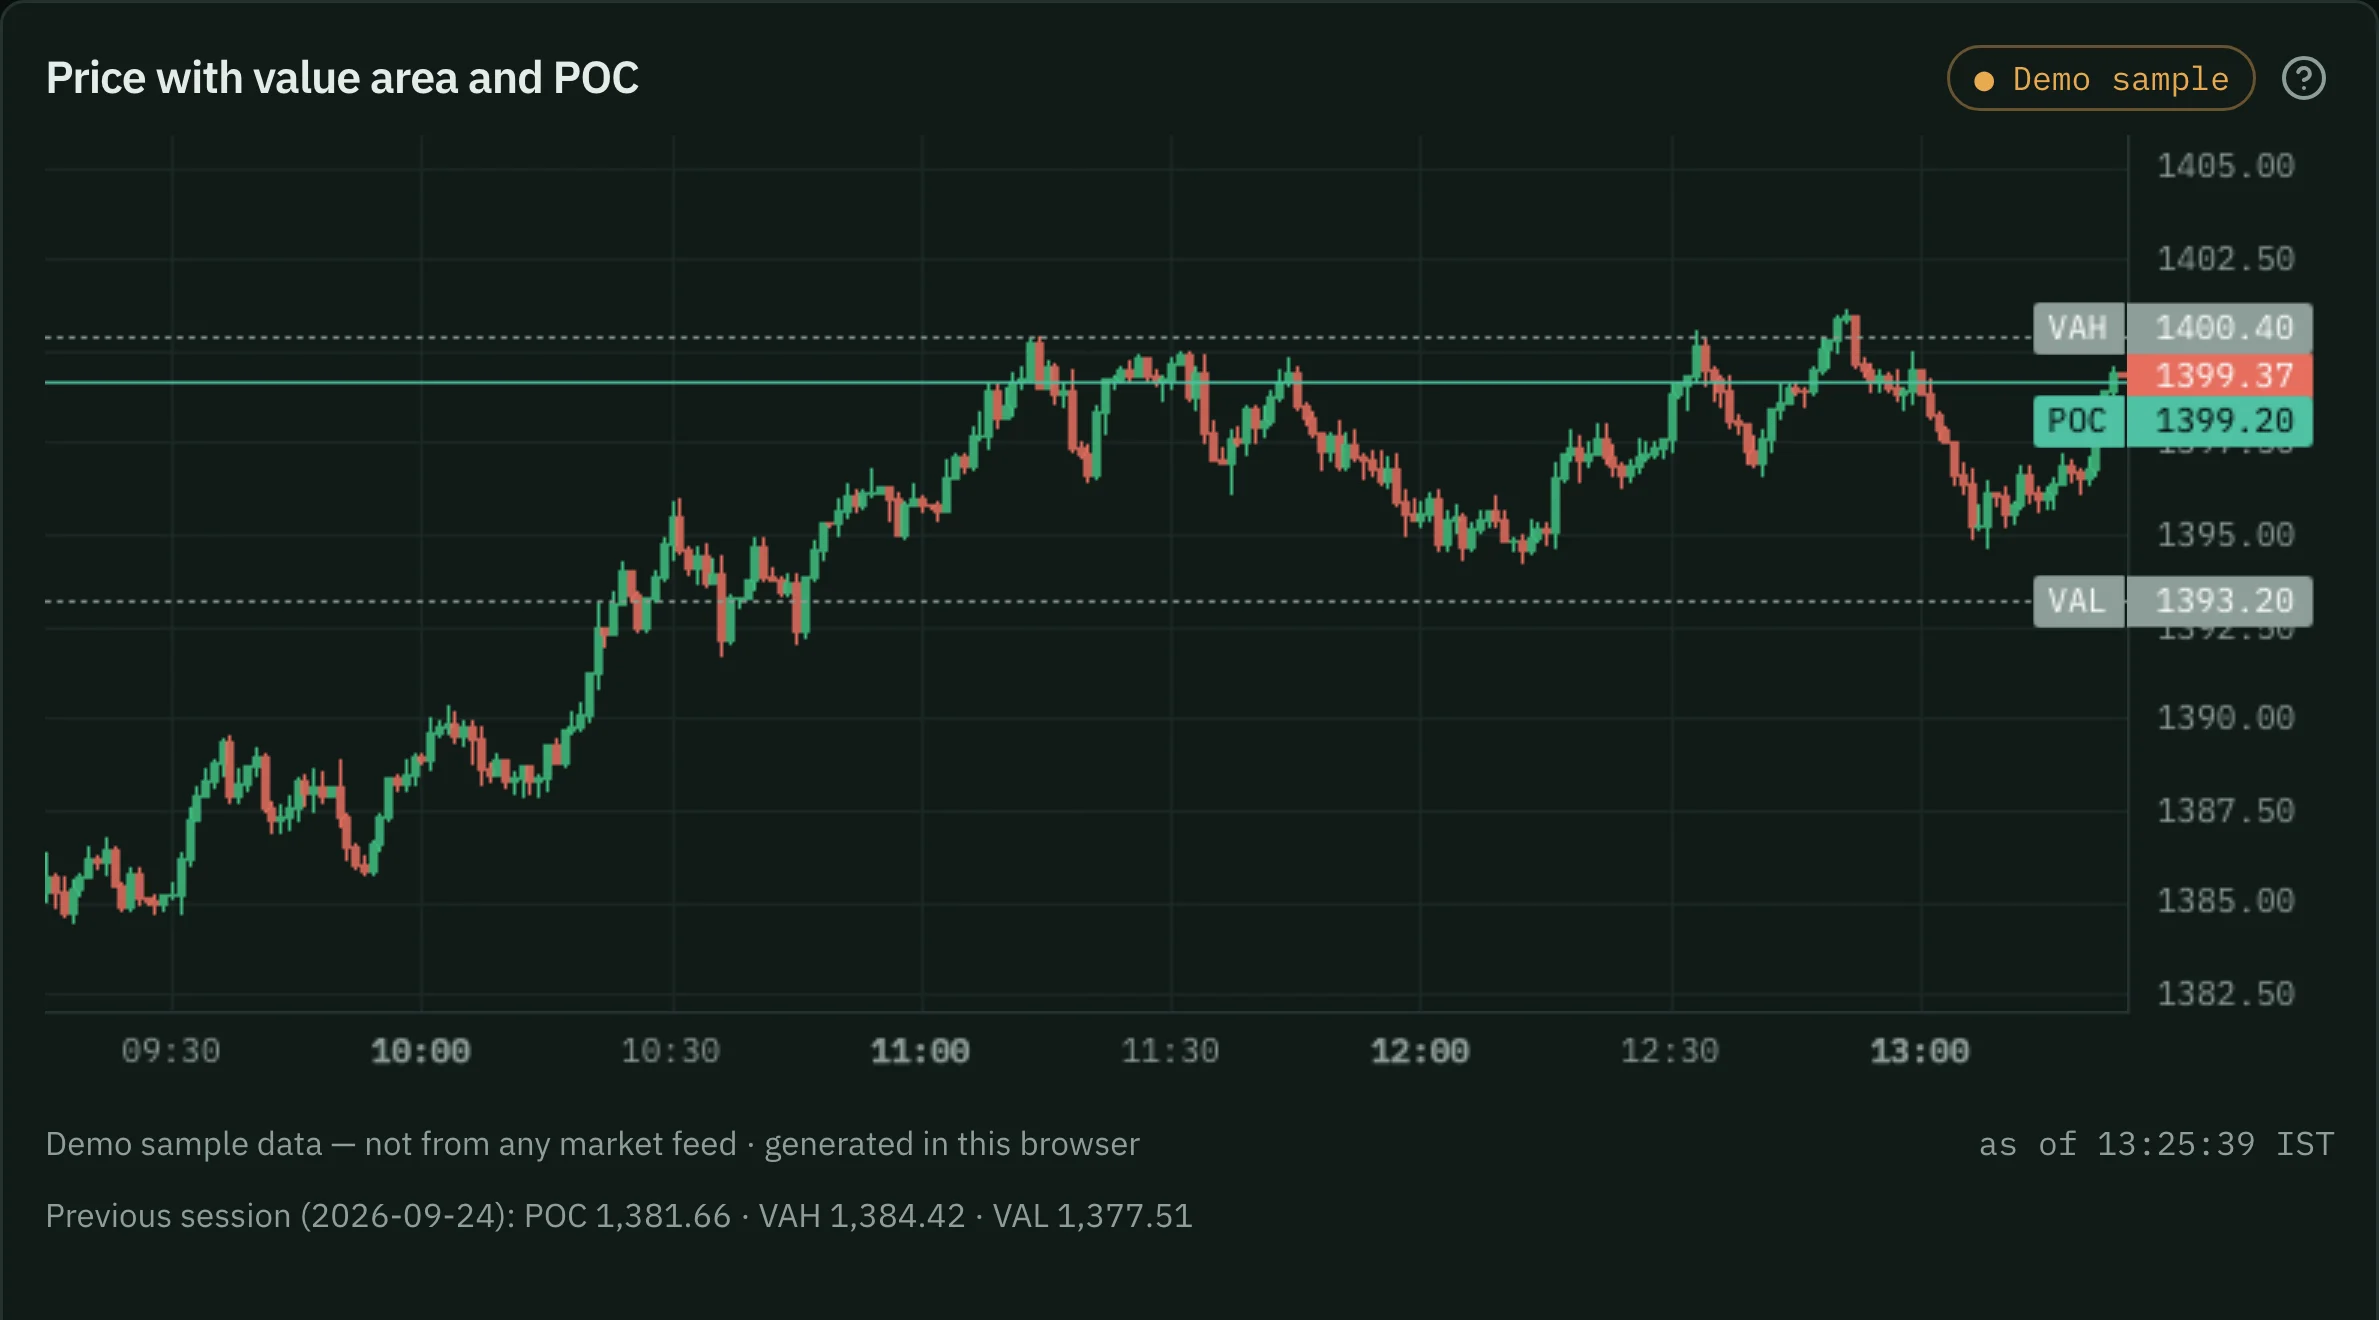
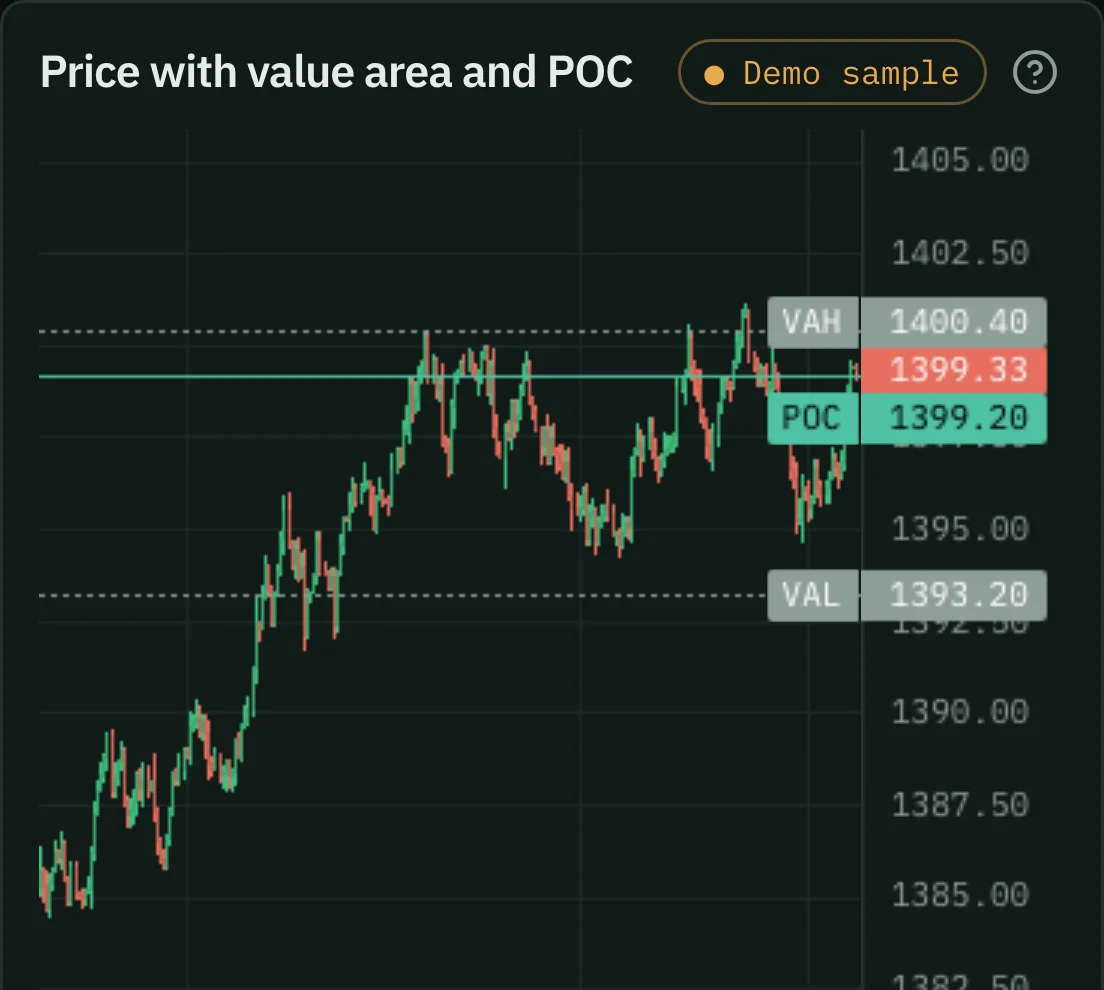
Executed volume split by which side crossed the spread: delta per minute, cumulative delta since the open, and the volume profile with its value area.
Sample observationNIFTY fut · Buyers 55 % of volume, last 30 min
See it live in the demo Pro
On the Depth page
The 20-level order book on NSE instruments: imbalance against the session, the top 5 levels against all 20, and unusually large resting orders.
Sample observationNIFTY fut · Book imbalance +1.8 σ against the session
See it live in the demo Free
On the Option chain page
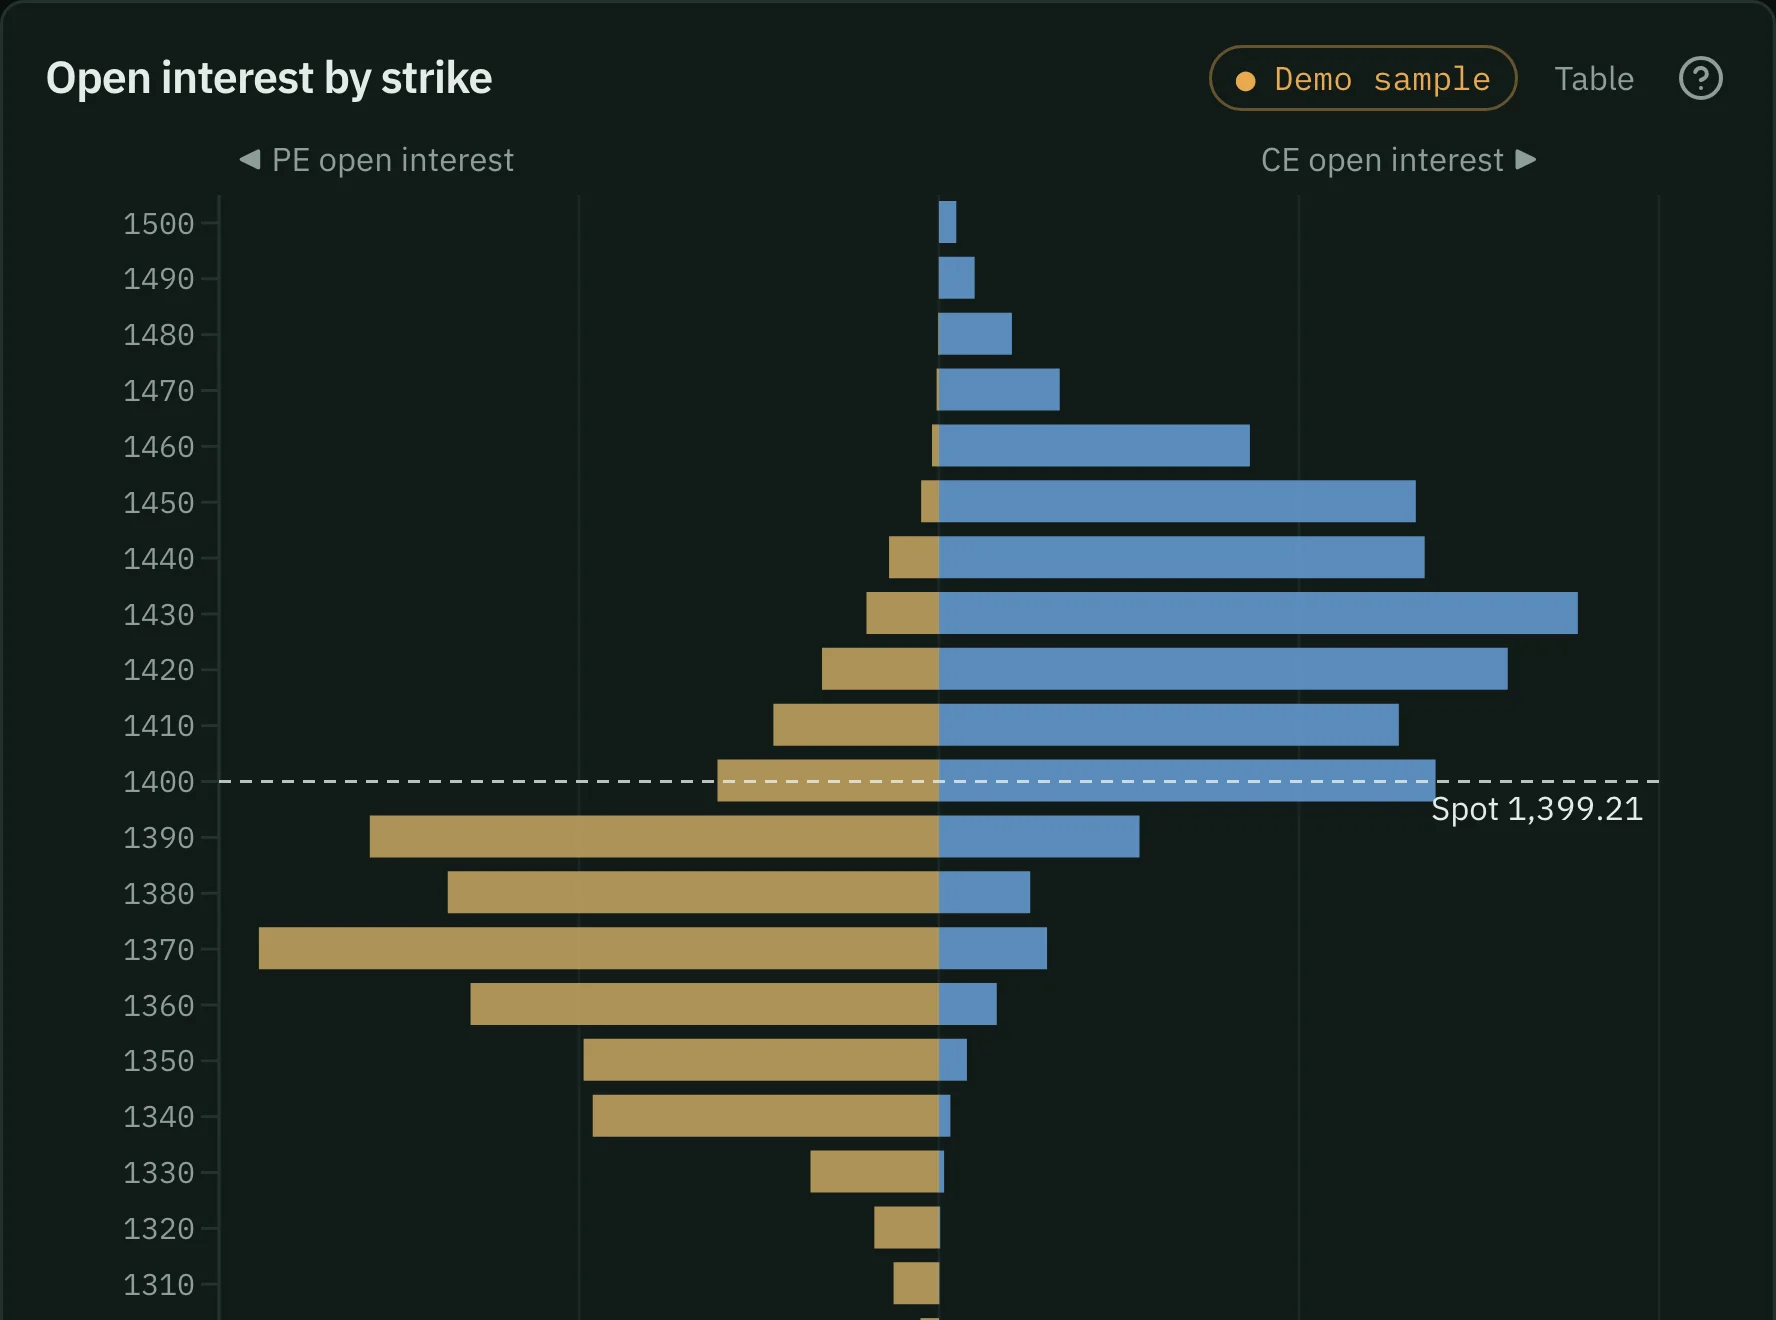
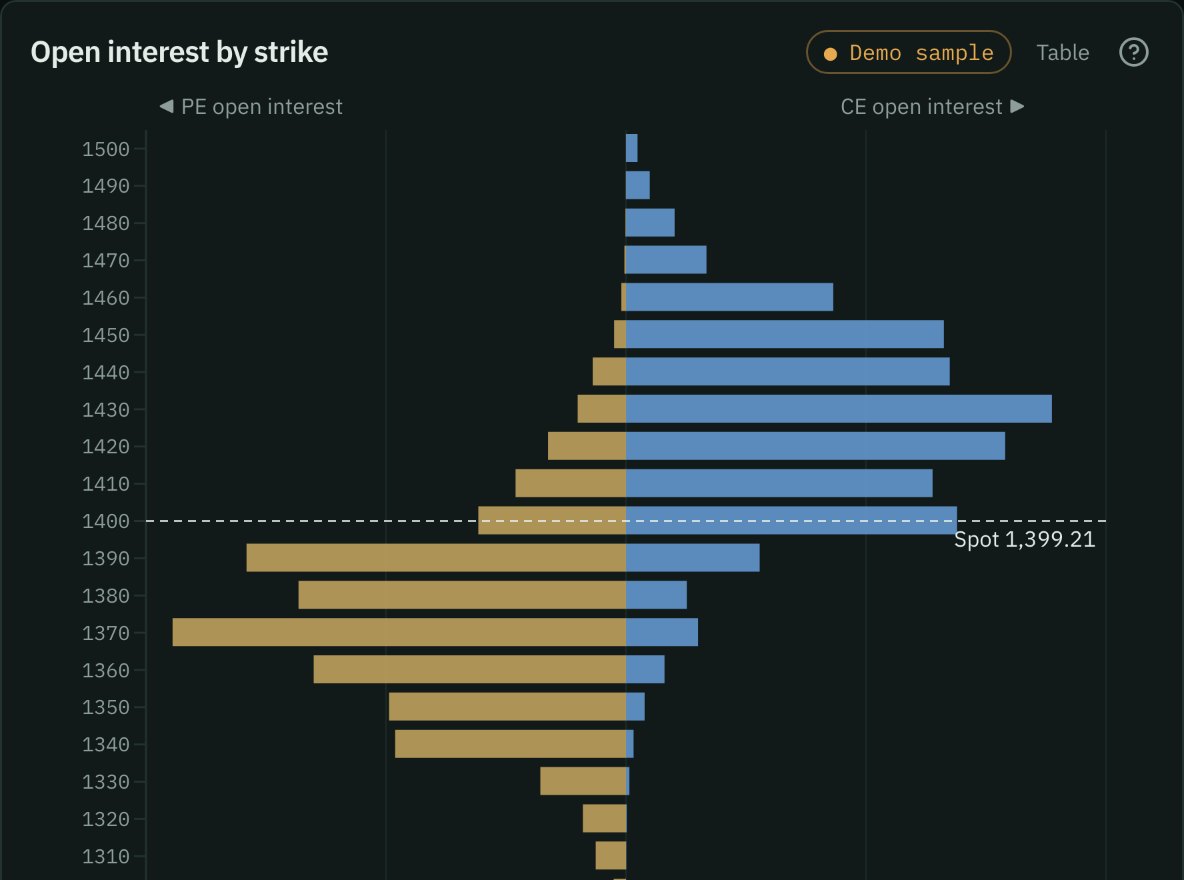
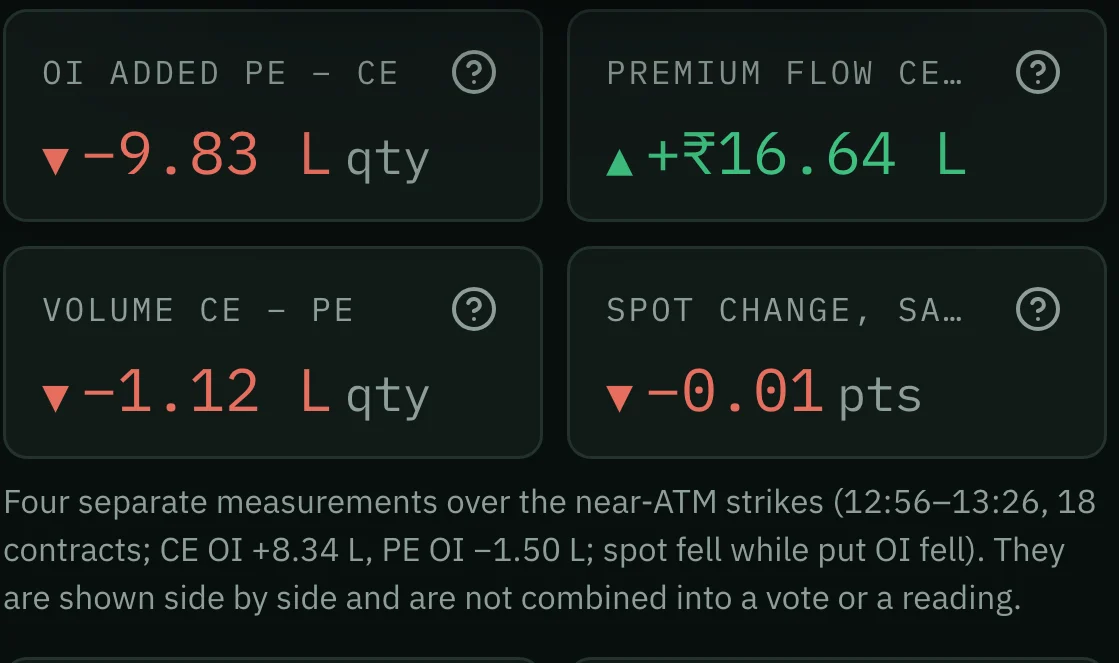
Open interest by strike, puts on one side and calls on the other, the OI added in the last 30 minutes, and four flow reads shown side by side — never combined into a vote.
Sample observationNIFTY options · Put/call OI ratio 0.96
See it live in the demo Pro
On the Straddle page
The at-the-money call plus put, minute by minute through the session, and the one-session move that price implies.
Sample observationBANKNIFTY options · Straddle since the first sample: −9.6 %
See it live in the demo Free
On the Volatility page
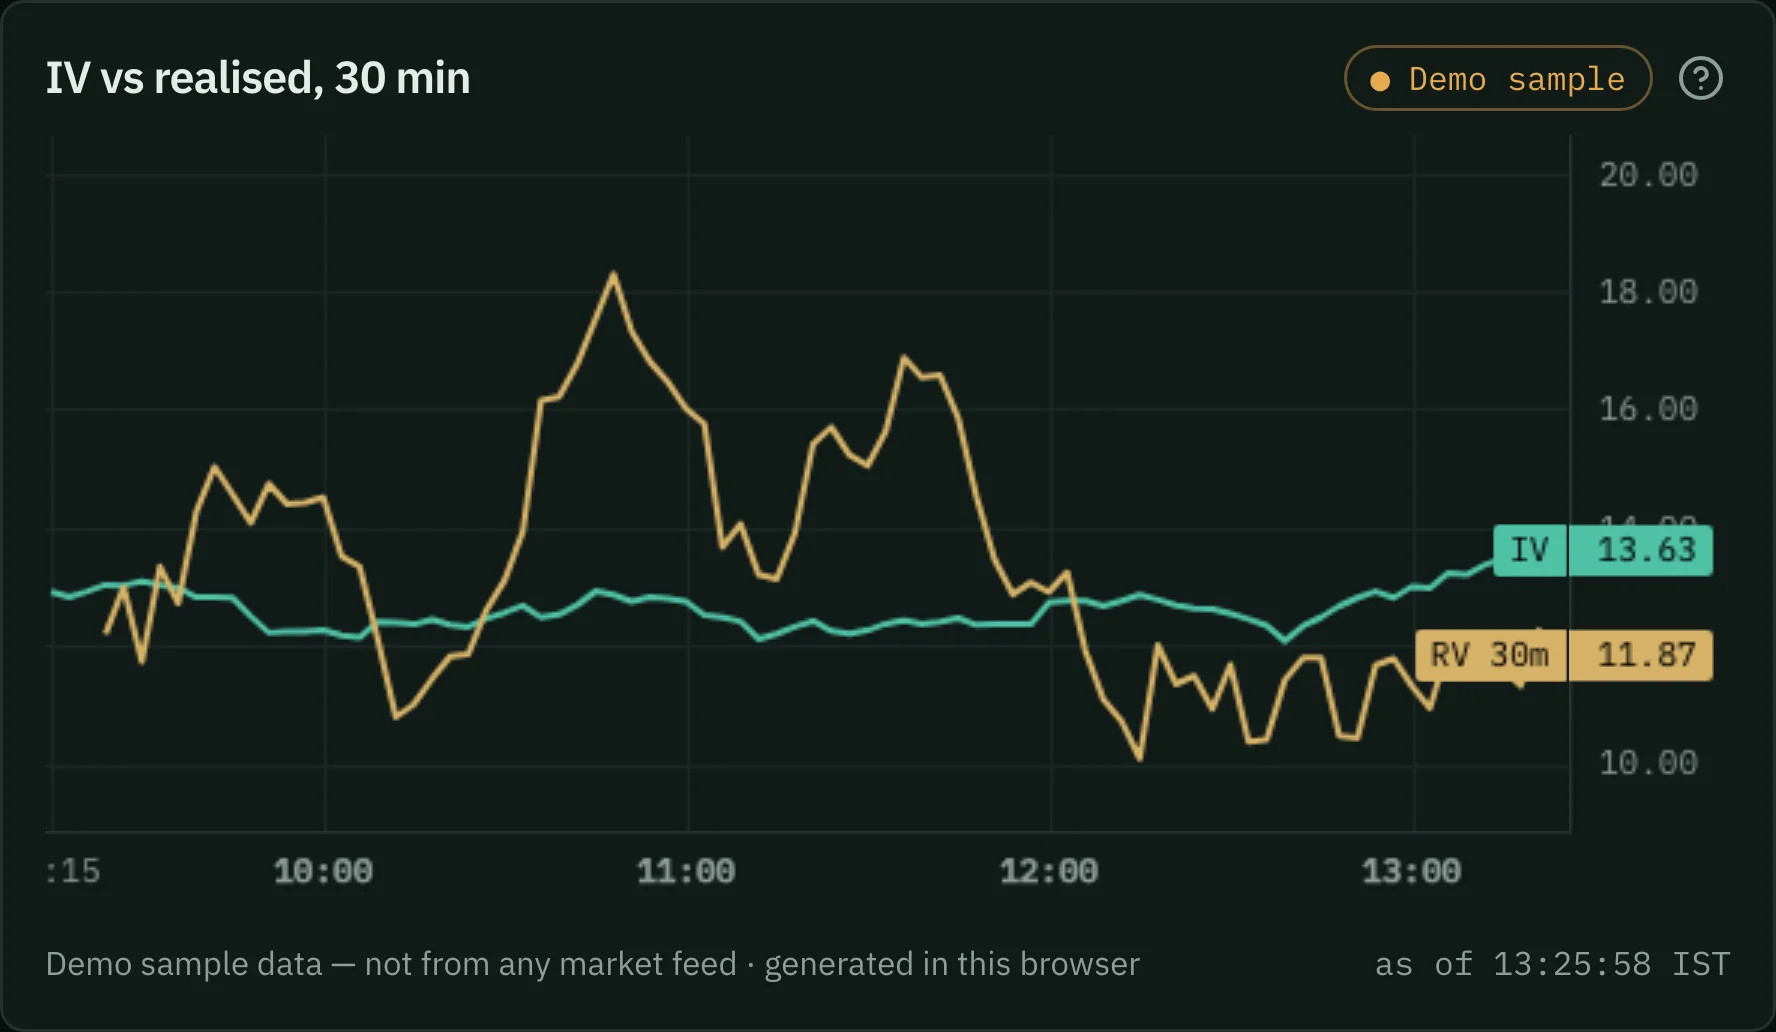
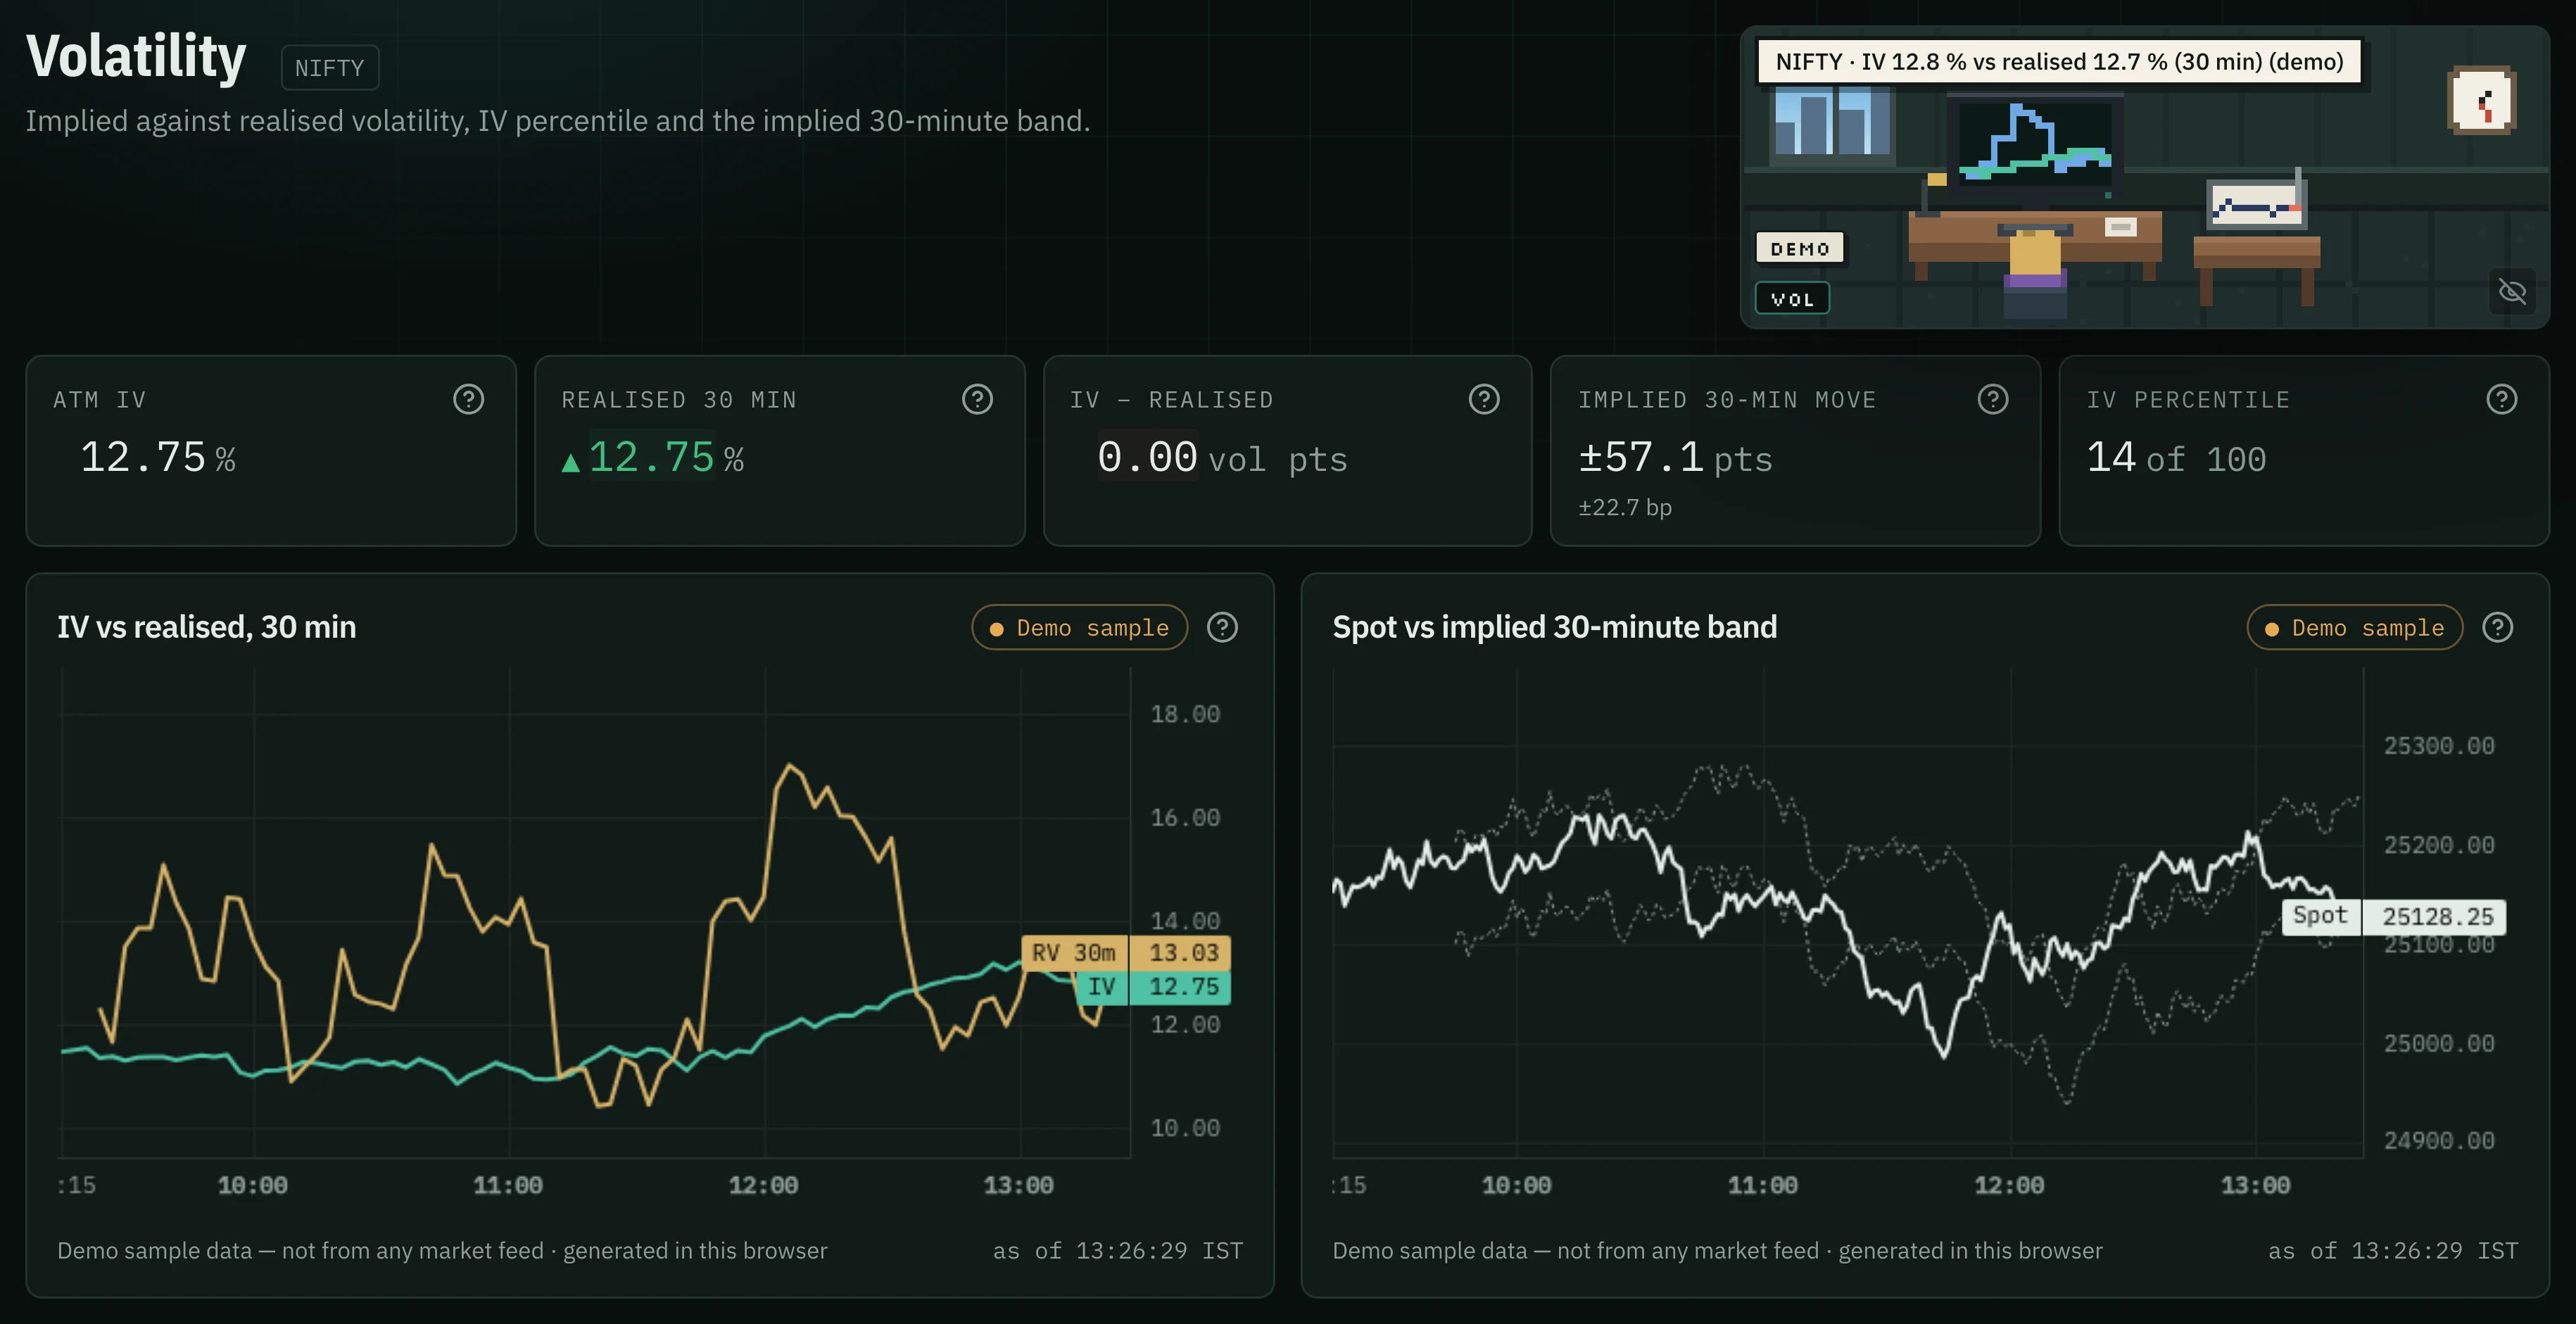
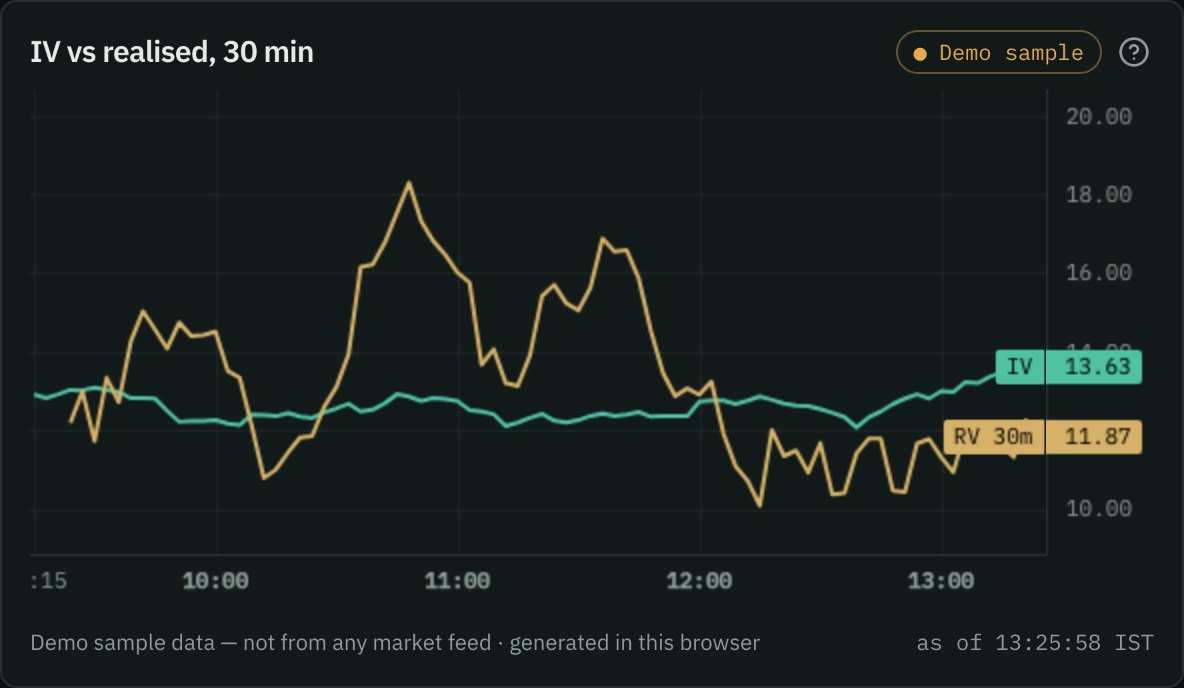
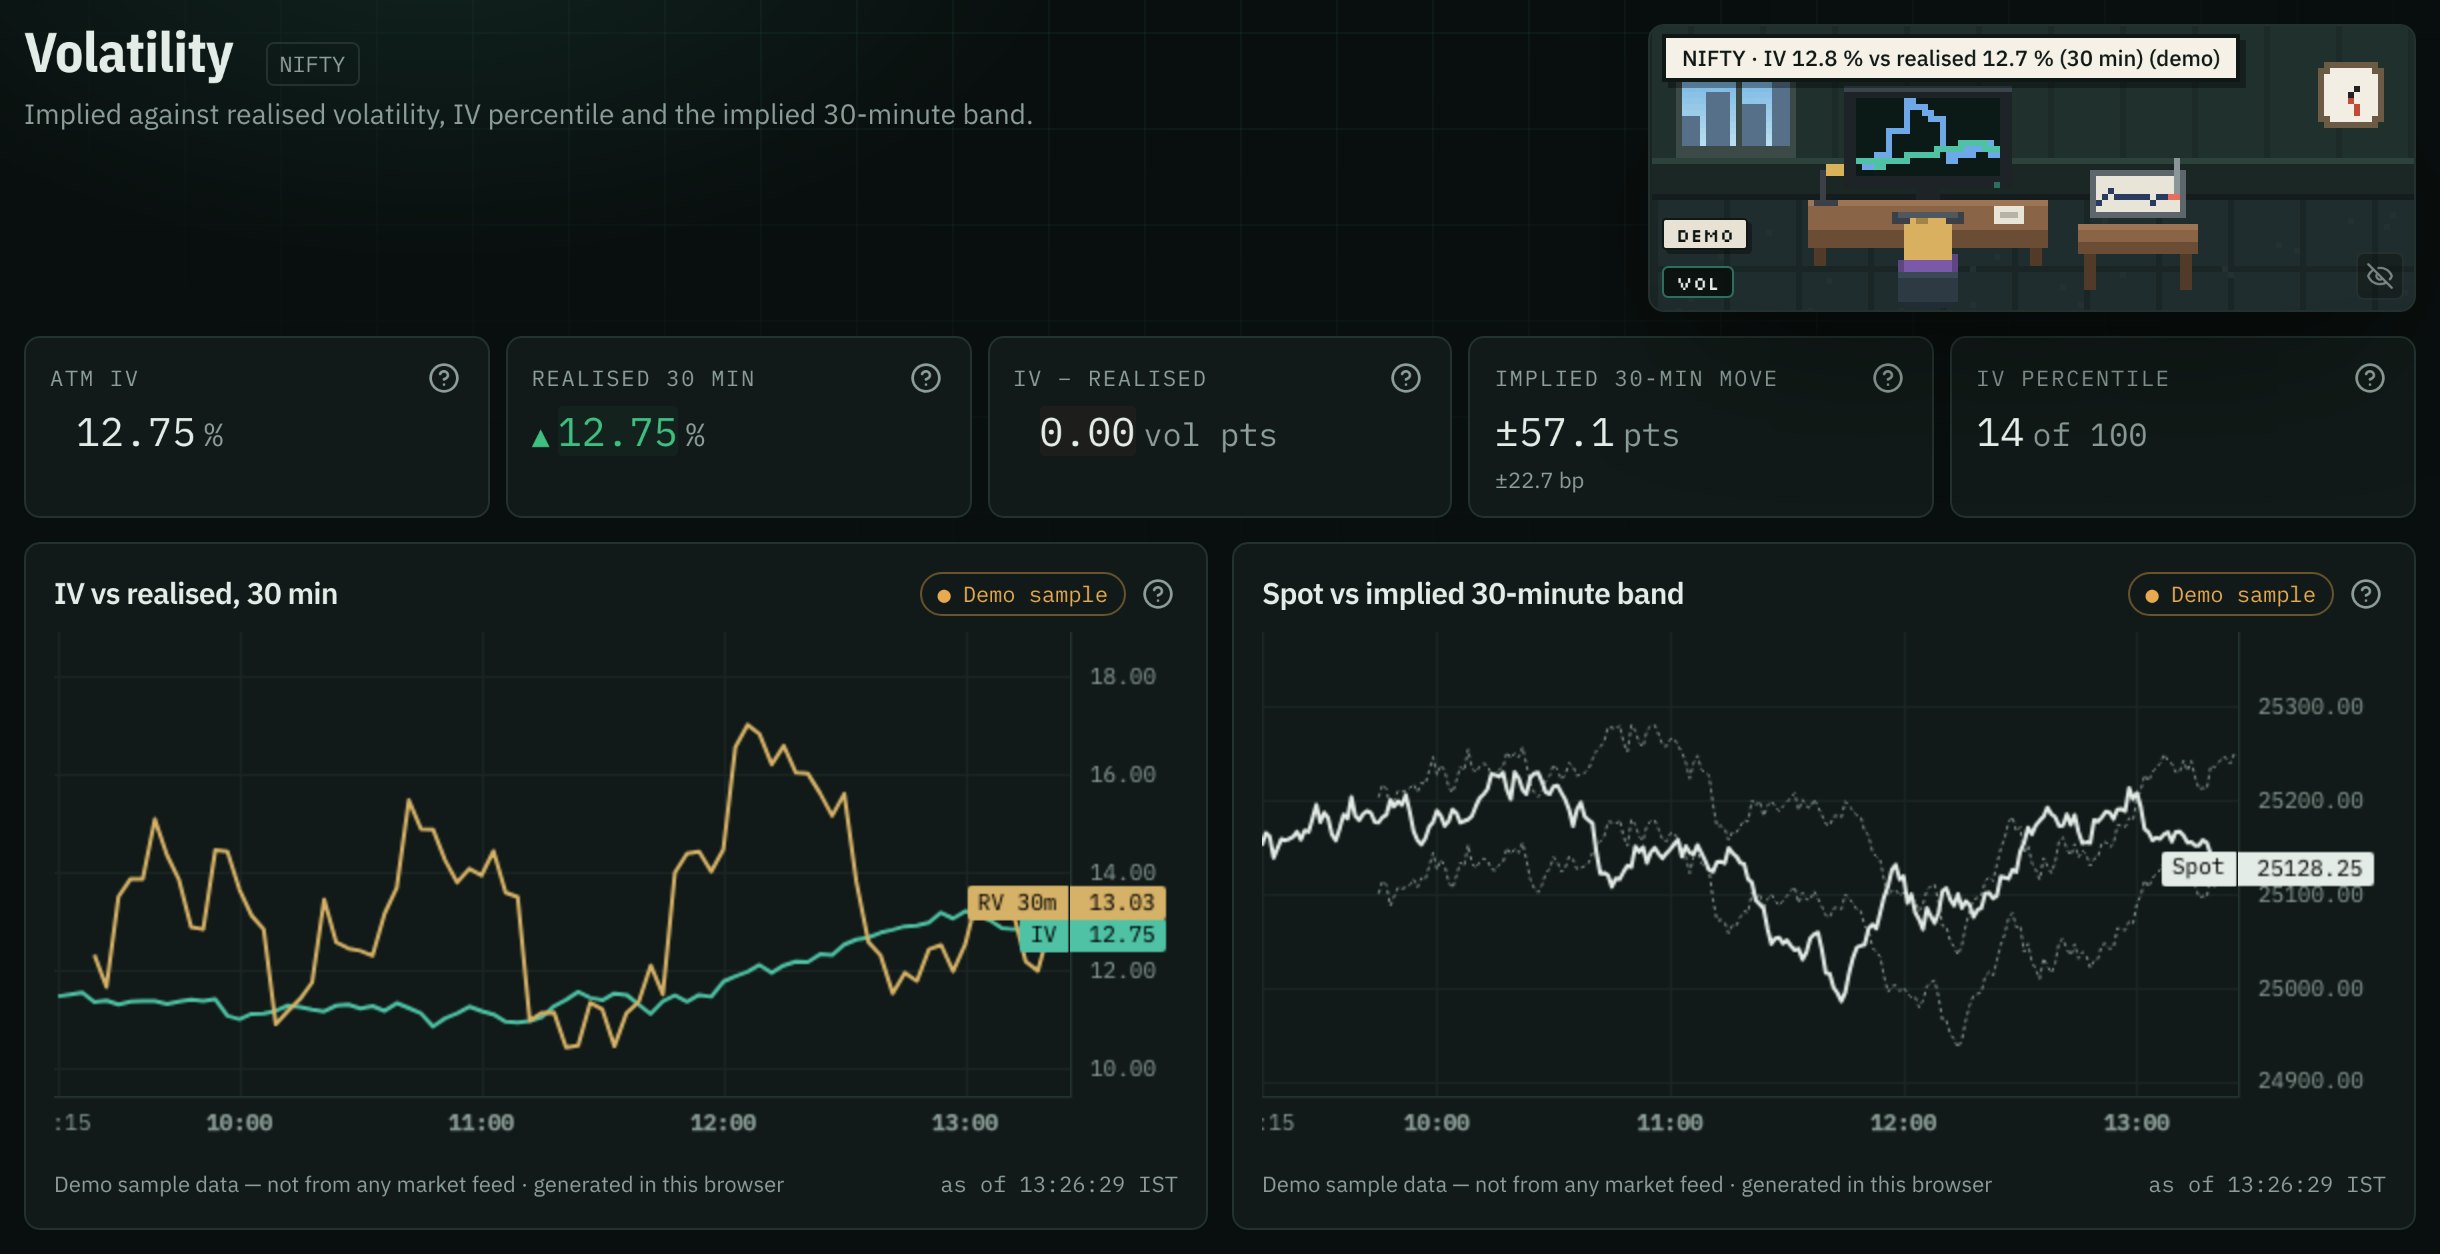
At-the-money implied volatility against what the underlying realised over 30 minutes, its percentile over up to 250 sessions, and the implied 30-minute band.
Sample observationRELIANCE · IV 12.0 % vs realised 16.0 % (30 min)
See it live in the demo Pro
On the Basis page
Each future against its spot in basis points, with a ±2σ band from its recent history and the 30-minute change lined up across indices.
Sample observationBANKNIFTY fut · Basis +1.9 σ from its recent mean
See it live in the demo Pro
On the Regime page
The kind of day it is: the range against the last 60 sessions, the opening gap, the day type and the events calendar.
Sample observationNIFTY · 20-session median range 0.92 % of spot
See it live in the demoObservations are samples in the app's own wording: the instrument, a number, its unit and what it was measured against — never a view on what to do. Free and Pro show the lowest planned tier that includes each page.
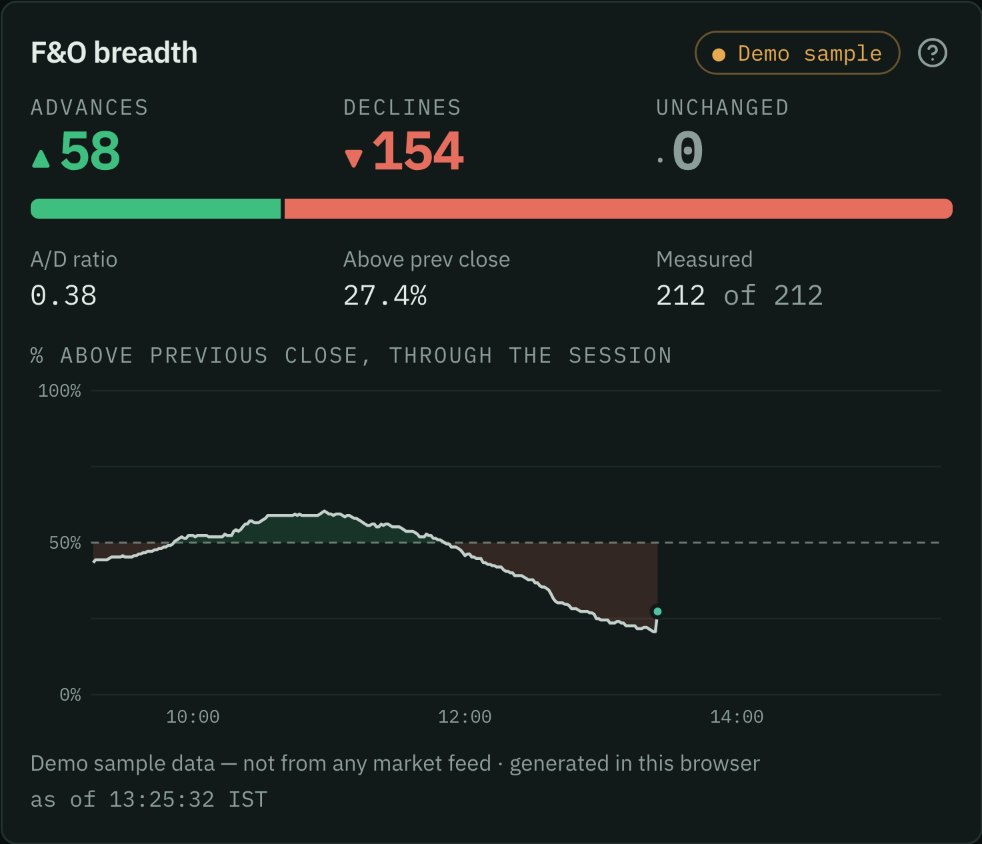
Market overview
See participation across F&O stocks, compare sectors, and find the symbols showing meaningful changes.

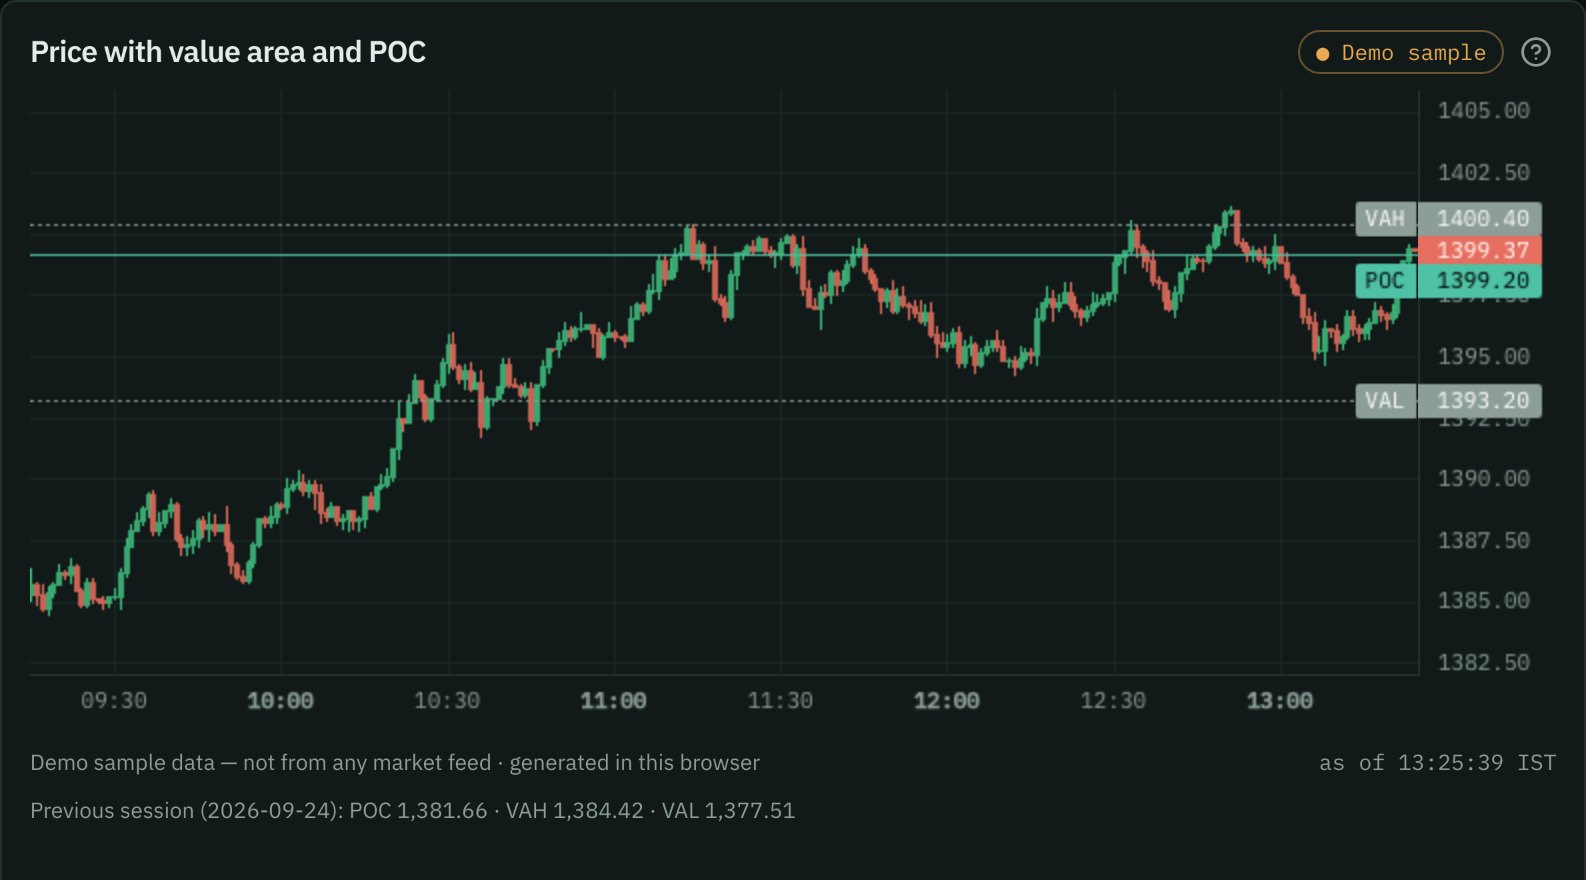
Symbol investigation
When something catches your attention, open the symbol and examine the data behind the move. Here: one stock, RELIANCE, on four of its pages.
How it works
The desk brings the evidence together; you decide whether there's a trade.
01 Scan the market
Breadth, sectors and every symbol as a tile, so you can see where the activity is.
02 Investigate the move
Open the symbol: price with its value area, the book, open interest and volatility, each with its time.
03 Make your call
Measurements sit side by side and are never combined into a verdict. The desk places no orders — the decision stays with you.
Data coverage
Clear data coverage matters when decisions depend on it.
| Coverage | Fields | Refresh | Source | Limitations |
|---|---|---|---|---|
| Indices | NIFTY, BANKNIFTY, FINNIFTY, MIDCPNIFTY (NSE), SENSEX (BSE) and India VIX: last price, change against the previous close, the session line | Index prices every 3 s; the Dashboard board every 15 s | Your Dhan feed | SENSEX is on BSE: no 20-level book |
| Breadth and sectors | Every NSE F&O stock (227 on 24 Sep 2026) — cash price and nearest future: advances and declines, movers, traded value, futures OI change, build-up type; 16 NSE sectoral indices | One batched request every 15 s in market hours | Your Dhan feed; previous-session OI from your recording or your daily history | Breadth history starts when the engine starts. Without previous-session OI the OI panels say “not available” instead of guessing |
| Symbol pages | The 5 indices and 30–40 F&O stocks ranked by option turnover: order flow, depth, option chain, straddle, volatility, basis, regime | Subscribed when you open the symbol | Your Dhan feed | Free covers the indices; stocks are Pro (planned) |
| Market feed | Last price, traded quantity, best bid and offer, OI — the broker's full packets for the futures (and cash stock) of each open symbol | About one snapshot a second per instrument — event snapshots, not every tick | Your Dhan feed | Order flow's buyer/seller split is inferred from those snapshots, so the footprint is approximate |
| Order book | 20 levels of bids and offers: imbalance, top 5 against top 20, large resting orders, cumulative depth | Streamed; imbalance history kept every 5 s | Your Dhan 20-level depth feed | NSE instruments only — not BSE, so not SENSEX |
| Option chain | Nearest expiry: OI by strike, OI added in 30 min, put/call ratios, ATM IV, straddle | The selected symbol's chain every 60 s in market hours | Your Dhan option-chain endpoint | Chain requests are spaced at least 3.1 s apart across symbols (Dhan's rate limit), so they are not tick-level |
| History | Daily candles (about 420 days), today's and the previous session's 1-minute candles; with the history download, expired options' 1-minute series (ATM ± 4 strikes) | Loaded when a symbol opens; the download runs when you start it | Dhan's historical endpoints — plus every session Crewdesk recorded | Order flow, 20-level depth and the full live chain exist only for days Crewdesk recorded; no broker keeps them |
| Flows and results | FII and DII net cash; board-meeting dates | When you import a file | A licensed source or an imported file — not the Dhan feed | Empty until you provide the data, and the page says so |
Inspectable
See what changed, when it changed and which market data supports the observation.
Built on Dhan
Crewdesk's live numbers come from DhanHQ, Dhan's trading and data APIs: the order book, option chains, open interest and volatility we measure, streamed live.
Dhan streams 20 price levels on each side of the book over its API. That is what our Depth agent reads: imbalance against the session, the top 5 levels against all 20, and unusually large resting orders.
Strikes, open interest, volumes, implied volatility and Greeks for the whole chain in one call, refreshed through the session. The Chain, Straddle and Vol agents are built on it.
Dhan lists 50+ platforms built on DhanHQ, including TradingView and smallcase. If you trade with Dhan, Crewdesk sits alongside the tools you already use.
You don't need a Dhan account to use Crewdesk. If you'd like one: dhan.co. Dhan doesn't pay us for this section; we've applied to its partner programme. Dhan is a trademark of Raise Securities Private Limited.
Pricing
Paid plans open with the beta. Everyone on the waitlist by 31 Dec 2026 keeps the launch price below, whenever they subscribe. On every tier, today's session stays on screen after the close until the next session opens. No broker data plan needed: the live data is included.
Launch price: join the waitlist by 31 Dec 2026 and keep Pro at ₹699 ₹399 / month (43% off) or Lab at ₹1,299 ₹749, whenever you subscribe.
At beta launch
₹0
At beta launch
₹699 ₹399 / month 43% offor ₹3,990 / year ₹5,999 · 2 months freeLaunch price for everyone on the waitlist by 31 Dec 2026 (or subscribed by then), kept for as long as you stay subscribed. After that: ₹699 / month.
At beta launch
₹1,299 ₹749 / month 42% offor ₹7,490 / year ₹10,999 · 2 months freeLaunch price for everyone on the waitlist by 31 Dec 2026 (or subscribed by then), kept for as long as you stay subscribed. After that: ₹1,299 / month.
Founding 50
3 months free, everything unlocked. Then ₹399 / month.
The first 50 people on the waitlist get 3 months of Crewdesk with every page and the Lab unlocked, free, with no card or UPI asked for. After that, if you want to stay, it's ₹399 / month or ₹3,990 / year; nothing renews or charges on its own. We ask for honest feedback through an in-app form and a short call; access never depends on what you say, and if you post a public review we'll ask you to mention that you received free access.
Early access
Tell us your broker and what you trade, so we know who we're building for. The first 50 on the list are the Founding 50: 3 months free.
We store your email, broker, what you trade, your note and when you agreed to hear from us — only to invite you and tell you about the launch. No selling, no sharing. To have your details deleted, write to admin.crewdesk@gmail.com. Waitlist privacy note.
FAQ
From Dhan's market-data API, measured on Crewdesk's server and shown in your browser. History comes from Dhan's historical endpoints plus every session Crewdesk recorded. Institutional flows and results need a licensed source or a file you import; those pages say which.
It is as fast as Dhan's feed allows. Dhan's full packets arrive as event snapshots — about one a second per instrument, not every tick. The Dashboard board refreshes every 15 s and each option chain every 60 s. Every number shows the time it was measured, and a late value says “Delayed” rather than pretending to be live.
All five indices — NIFTY, BANKNIFTY, FINNIFTY, MIDCPNIFTY and SENSEX — with India VIX; every NSE F&O stock in breadth; and 30–40 F&O stocks, ranked by option turnover, with their own pages. The 20-level book is available for NSE instruments only, so not for SENSEX. The full table is under Data coverage.
No. It has no order capability at all: the software reads market data only and has no code path to any broker's order API.
There is nothing to install. When your invite or payment goes through you get a one-time link: choose a password, save your recovery codes, and Crewdesk opens in your browser. It is best on a computer, in Chrome, where the live numbers keep updating; it works on a phone too. You can try the desk on sample data now: Explore the desk.
Cancel any time from your UPI app, and keep access until the end of the period you paid for. Payments are not open yet; nothing is charged while you are on the waitlist.
No. Crewdesk shows measurements — numbers with units, times and sources. It does not tell you what to trade, when, or at what price. It is not SEBI-registered advice, and Crewdesk is not registered with SEBI in any advisory capacity.
Your email, a salted hash of your password (never the password itself), your plan, and the devices you are logged in on, so you can log them out. We never ask for your broker key, password or positions, and Crewdesk has no way to see or place trades.
Open the workspace and explore what's happening across F&O.
Measurements only — not investment advice. No order placement. Nothing to install: it runs in your browser.